
Setup
This describes the setup process to get the Grafan Panel to display the status of all devices connected to the openHistorian. If using the openPDC the setup process is very similar.
Note that these instruction assume the openHistorian version 2.7.90 or greater is installed (or openPDC version 2.8.60). In addition it is assumed Grafana version 6.5.0 or greater with the openHistorian data-source plugin is installed (included in the openHistorian installation).
Setup of the Action Adapter
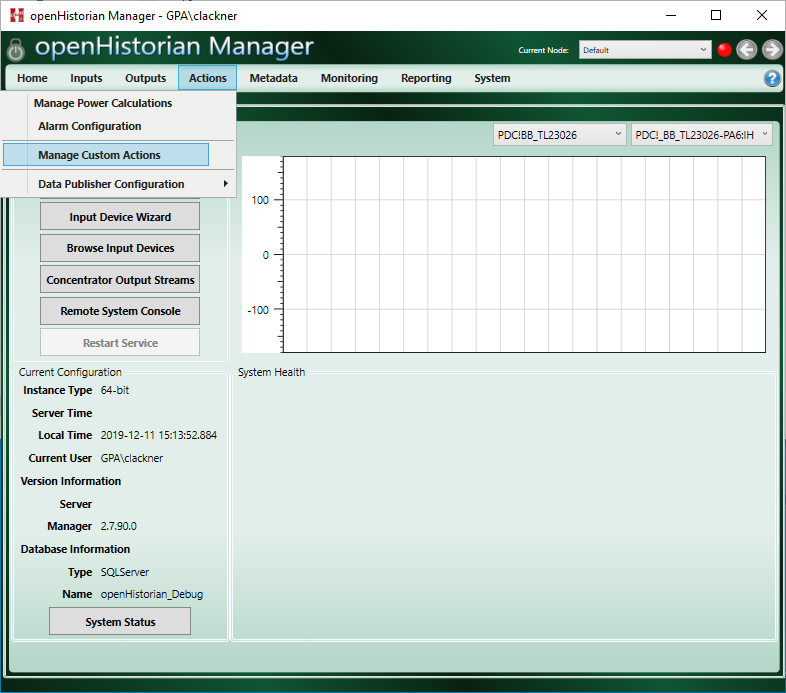
First the Device Alarm State action adapter has to be setup in the openHistorian. To do so start the openHistorian Manager and Click on Manage Custom Actions in the Actions tab
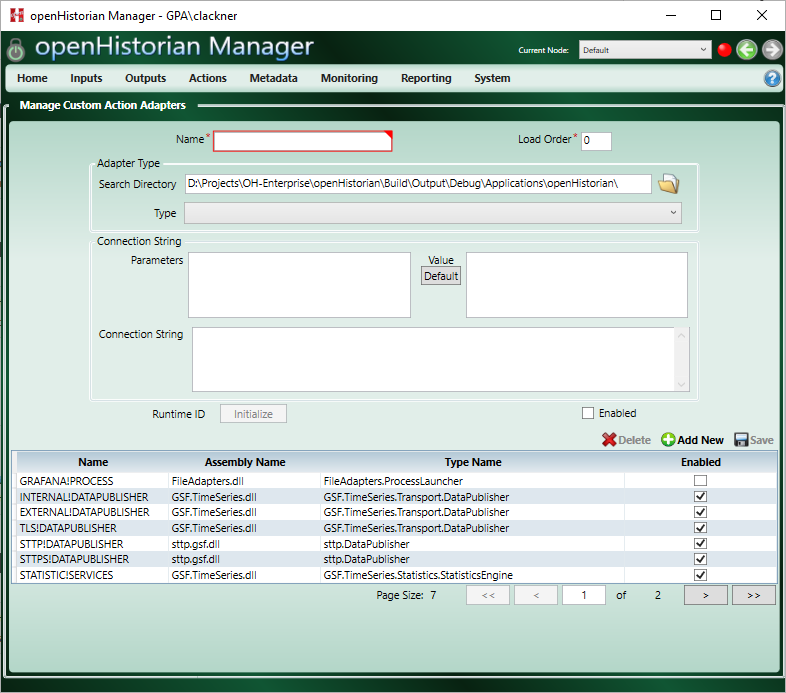
Next add a new action adapter by clicking on Add New
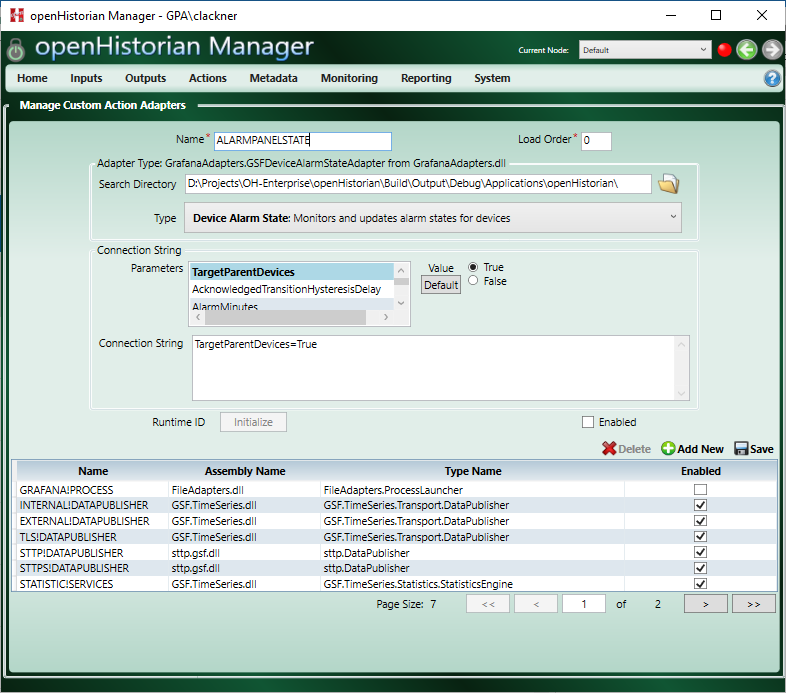
The adapter should be of type Device Alarm State and the following settings are necesarry, the values are only suggested and can be changed. Additionally the setting listed here can be adjusted to customize the device status.
- Name: AlarmPanelState
- TargetParentDevices: True
Note that the adapter also needs to be Enabled before saving it by clicking on Save
Setup of the Grafana Plugin
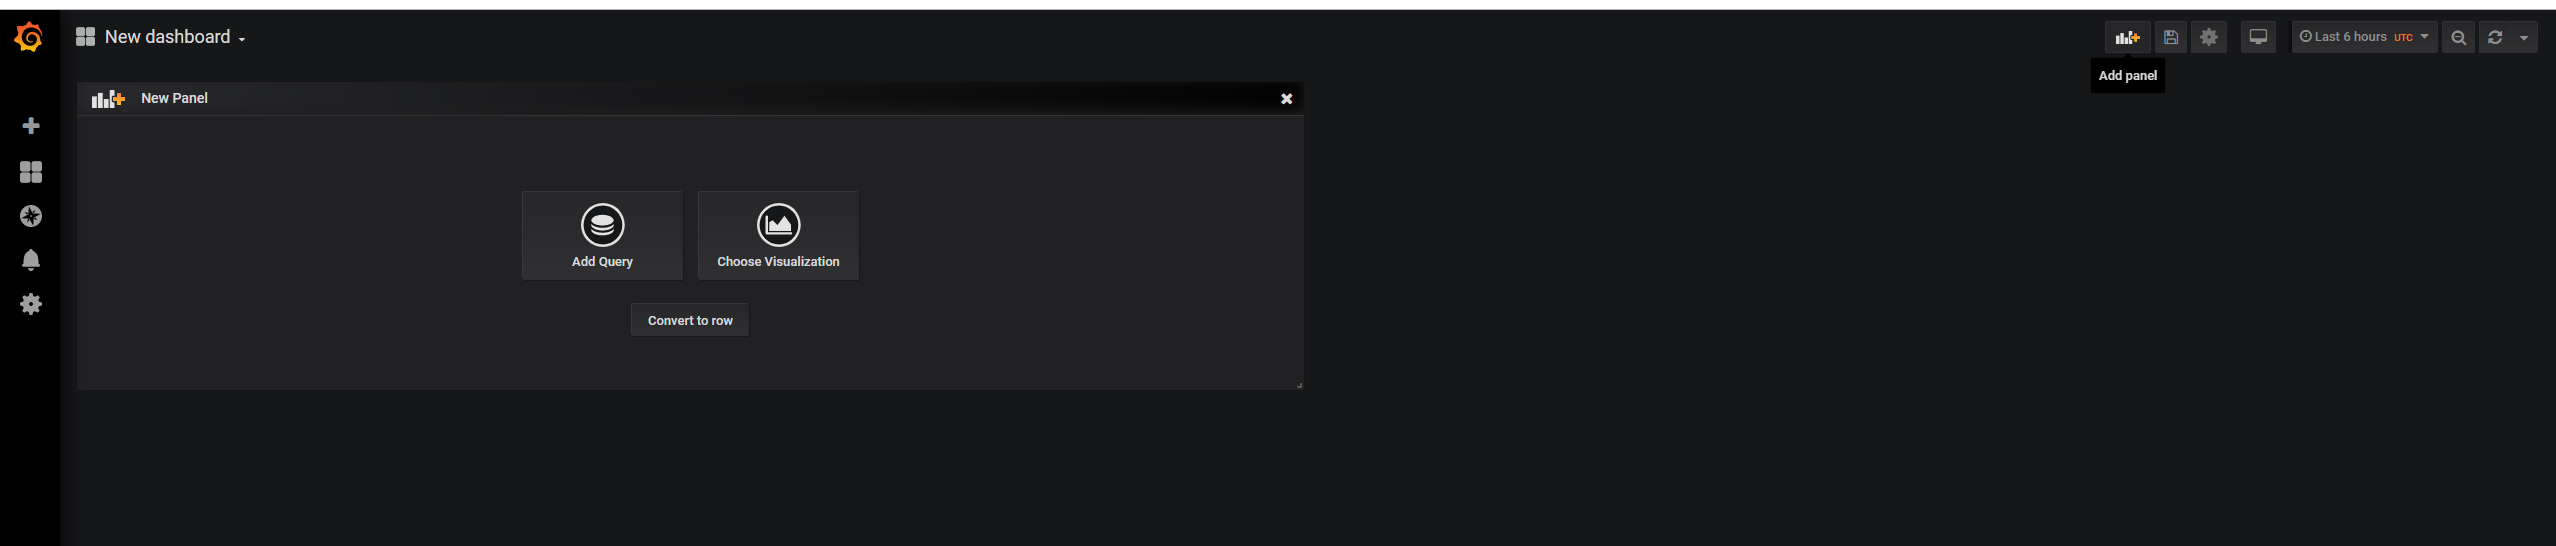
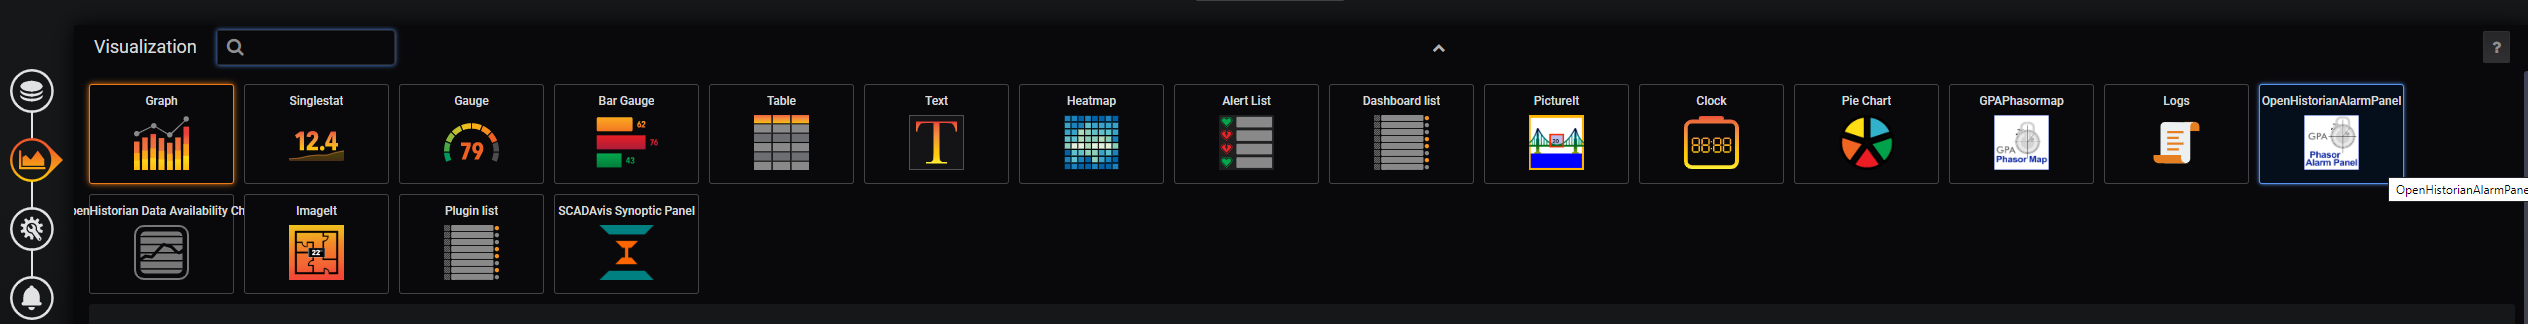
Note that these instructions assume the Data-source Plugin has been setup or the Grafana instance included in the openHistorian is used. After setting up the action adapter the Phasor Alarm Panel can be added to a dashboar in Grafana. To add the panel click Add Panel in the upper right corner of Grafana. Then click choose Visualization and pick the OpenHistorianAlarmPanel
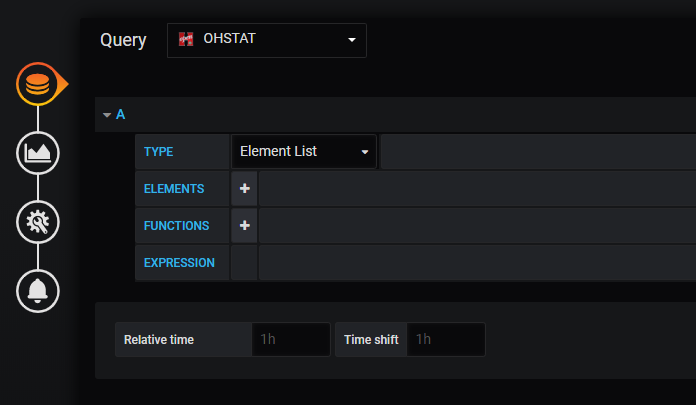
To finish the setup make sure the OHSTAT (or if using the openPDC the PDCSTAT) Datasource is selected.
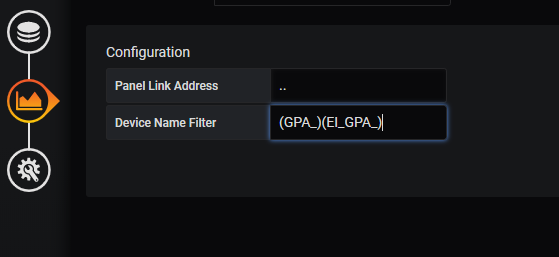
This example also includes the use of the filter to only show devices whose name starts with GPA_ or EI_GPA_ to achive that, type (GPA_)(EI_GPA_) into the Device Name Filter textbox.