
Overview
This plugin is a Grafana panel that shows Synchrophasor Data on a map. For this Panel to work the openHistorian Data Source plugin has to be installed and set-up and the openHistorian has to be installed. This panel also supports a variety of different overlay and background maps.
Description
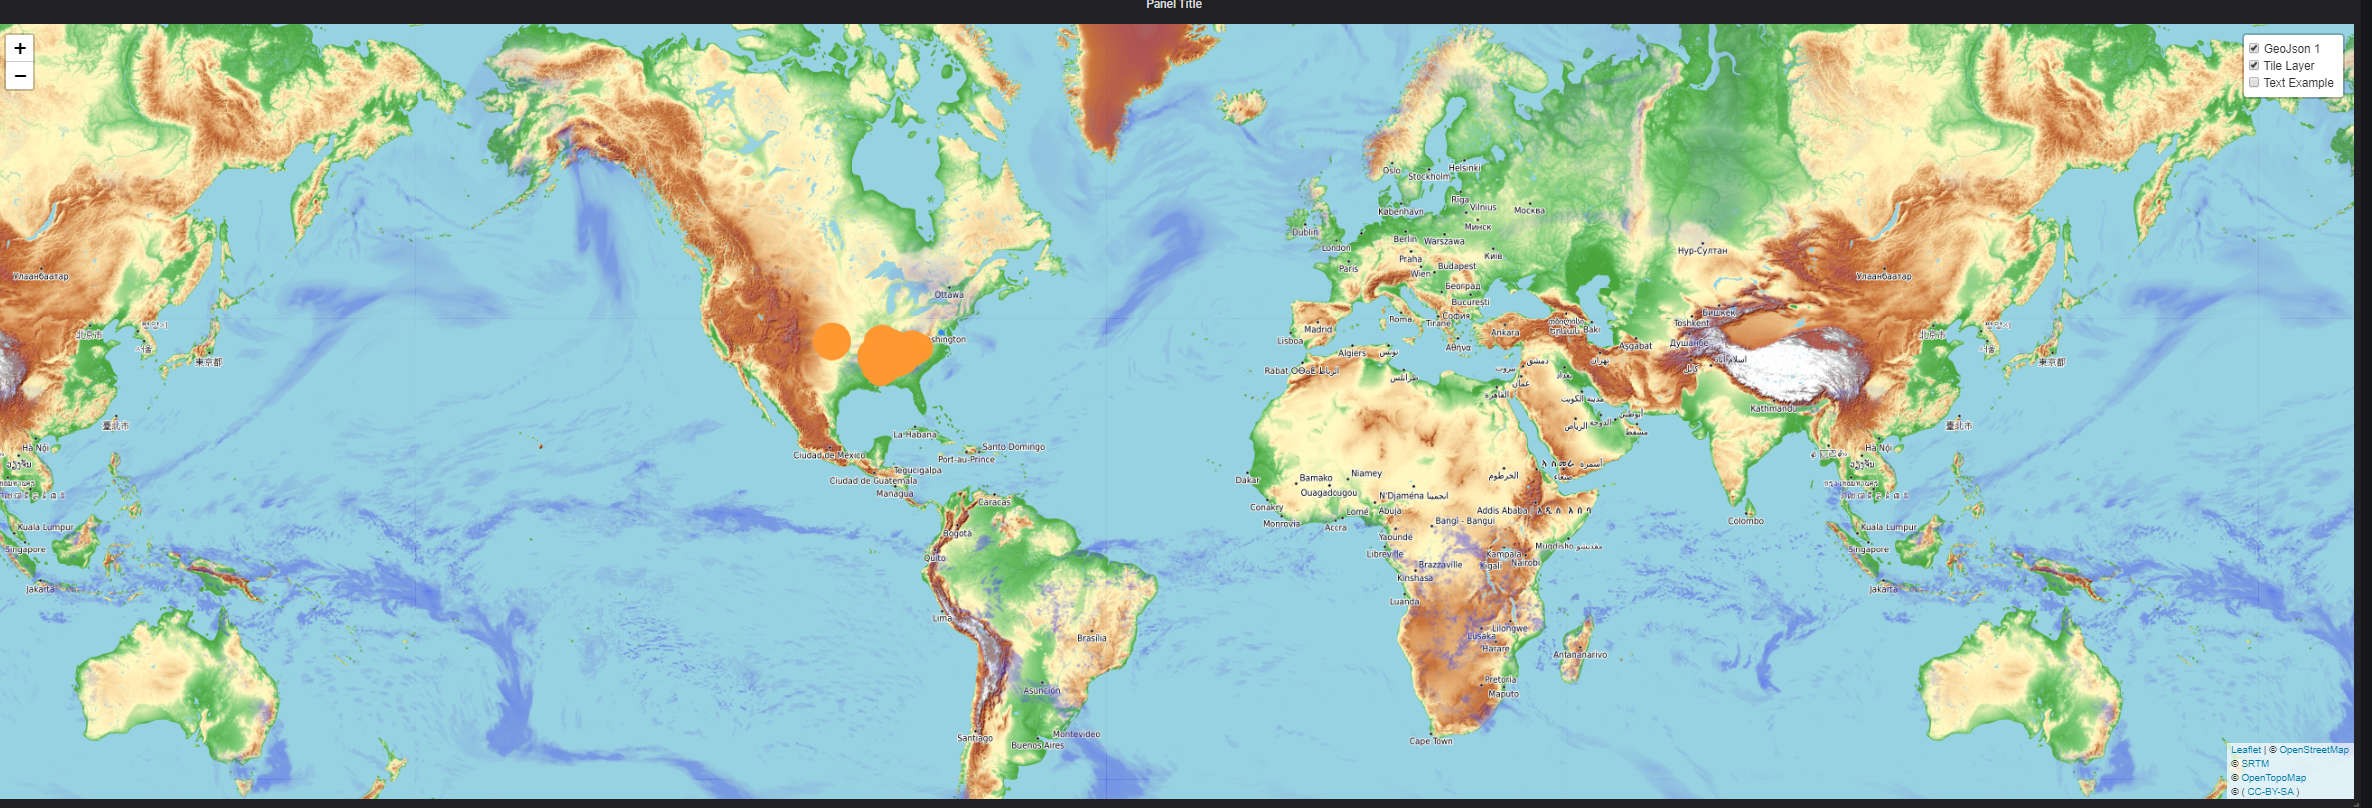
The panel shows a map with data visualized on top of it. The following visualizations are available:
-
Circles: The datapoints are visualized as circles with the size of the circle representing the value of the datapoint

-
4-Bit Bars: The datapoints are visualizaed as Bars with 4 Areas. Each Area is colored according to a bit in the data (Bits 0-3).

Settings
A full description of all available Settings can be found here